Live distribution
Pressure behavior could be viewed across the sensor surface.


Manufacturing · Sensor test instrumentation
An electronics manufacturer connected sensor-acquisition hardware, embedded firmware, and a Windows application to observe pressure distribution across a thin-film sensor surface.
The business context
An electronics manufacturer had developed thin-film pressure sensors but lacked a suitable combination of acquisition hardware and desktop software to test them. Manual checks consumed effort and provided a limited view of how the sensor responded across its surface.
The required product was a complete measurement workflow: acquire the sensor signals, convert the observations into meaningful pressure values, and show the distribution in a form an operator could examine. Shinetech worked on both the embedded acquisition side and the Windows application that made the readings visible.
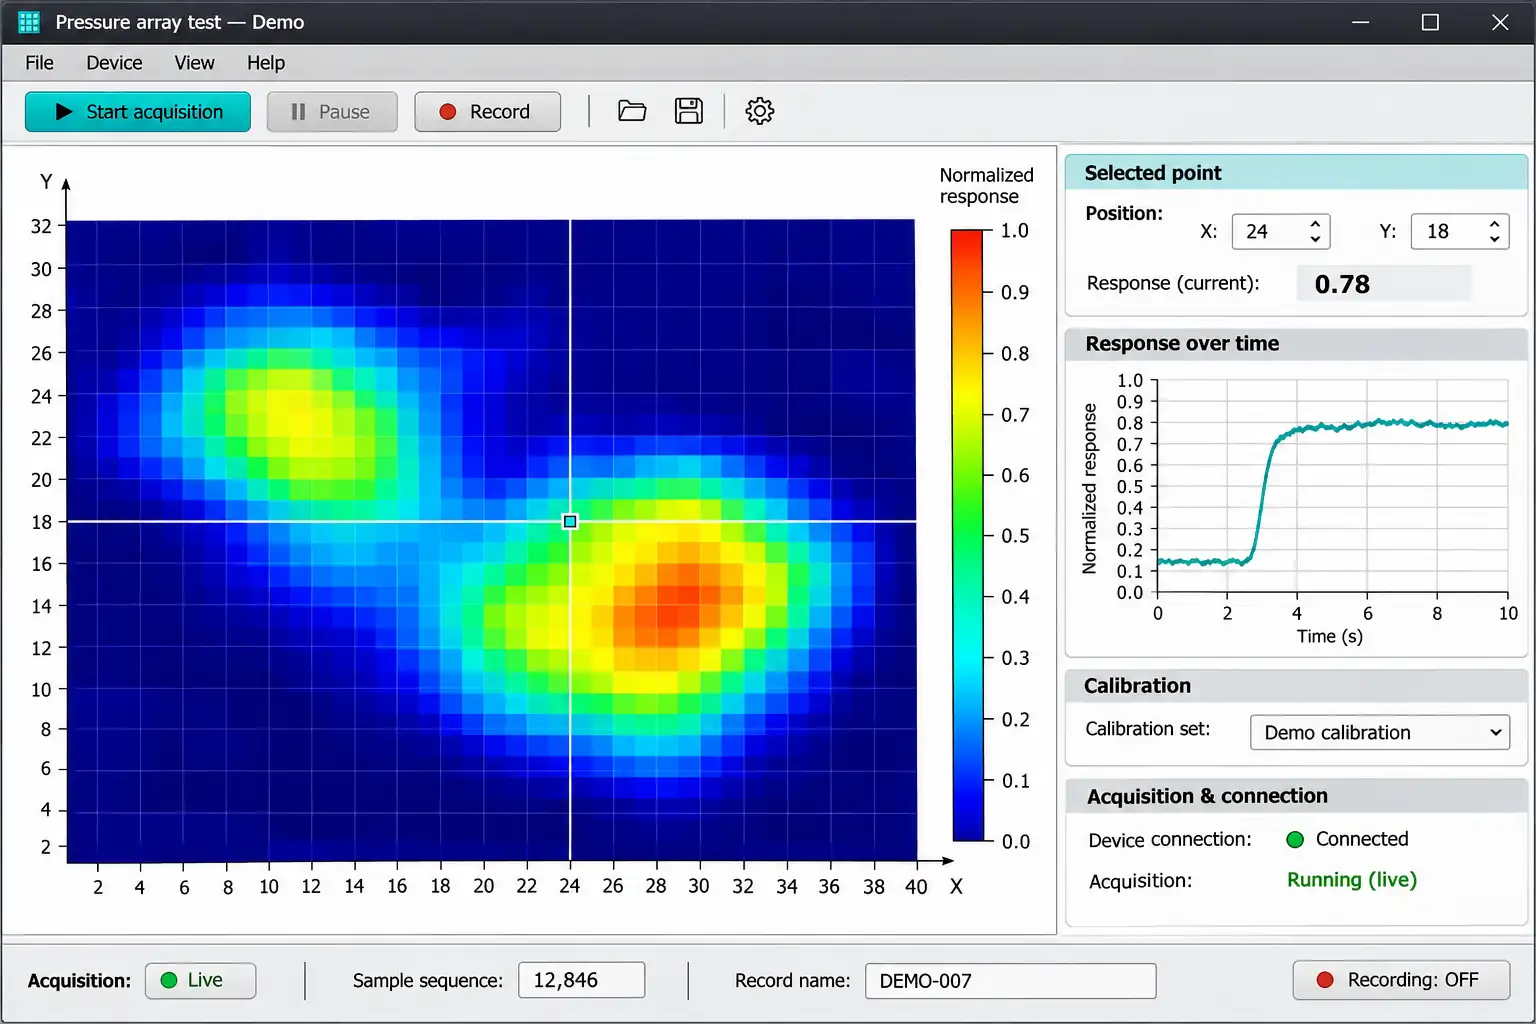
The sensor pattern, curve, positions, and normalized scale are synthetic. This illustrates a test workflow without revealing the customer’s sensor geometry or calibration data. View full-size interface (new tab)
The operating challenge
A useful heatmap depended on more than an attractive display. Hardware selection, embedded acquisition, data reception, and pressure conversion all had to work together. The team needed to establish the live path from the sensor to the two-dimensional view before treating the result as a finished product.
The first phase did not meet expectations, and hardware-board work contributed to schedule pressure. The team reassigned internal resources, revised the earlier work, and agreed the next steps with the customer. The case includes that recovery because the final result followed additional engineering work, not an uninterrupted first attempt.
The delivery decisions
The lower-level work covered hardware choices, embedded data acquisition, assembly, and testing. The desktop stream covered data reception, pressure conversion, and the two-dimensional display. Both streams contributed to the same sensor test task.
The early objective was a changing two-dimensional pressure view. Further work turned that proof of concept into the required hardware and application deliverables, including a relationship between pressure and resistance for quantitative analysis.
Delivery included the application, source code, operating documentation, and hardware design materials. That package made the acquisition device and the software a maintainable system rather than leaving the customer with only a visual demonstration.
The working detail
The operator could inspect a live pressure-distribution map across the sensor and examine readings at different positions. The project team reported that one person could perform the manual test using the delivered equipment.
The available evidence supports that change in capability. It does not provide a traceable measurement-accuracy benchmark, a certification result, or a quantified production-yield improvement. The mockup therefore uses a normalized illustrative heatmap instead of presenting synthetic values as calibrated production measurements.
The delivered result
Pressure behavior could be viewed across the sensor surface.
Acquisition hardware, firmware, and desktop visualization worked as a delivered system.
Executable, source, documentation, and hardware design files accompanied the result.
The revised delivery met the customer’s requirements after first-phase rework. No on-time-delivery, metrology-certification, or production-yield claim is made.
Case taxonomy
Discuss your project
Tell us how your business works and where your software needs to change.
Get in touch
Tell us what you need to build, modernize, automate, or augment with AI. We can start with a focused discussion or a no-risk 1-week trial.

“A fantastic company to work with.” After the initial rapid development project, American Shipping Co. kept two Shinetech developers embedded for nearly four years, supporting internal and external tools and new AI initiatives.
 CEO, American Shipping Co. - 5-star Google Review