Recovered reporting data
Repair scripts mapped retained source answers back into the expected reporting structure.


Business Software · Customer experience analytics
A customer experience service rebuilt slow reporting and recovered survey results from retained raw records, restoring the link between collected feedback and usable analysis.
The business context
The client helps consumer-facing brands understand customer experience through software and research. A report may bring together feedback from multiple locations, but the value lies in helping a business decide where an experience needs attention. Missing answers or a report that is too slow to explore undermine that work.
The existing system had an aging interface and slow data loading. Shinetech developed a replacement application and cloud data approach, then continued to improve the service as its reporting workload and operational needs grew.
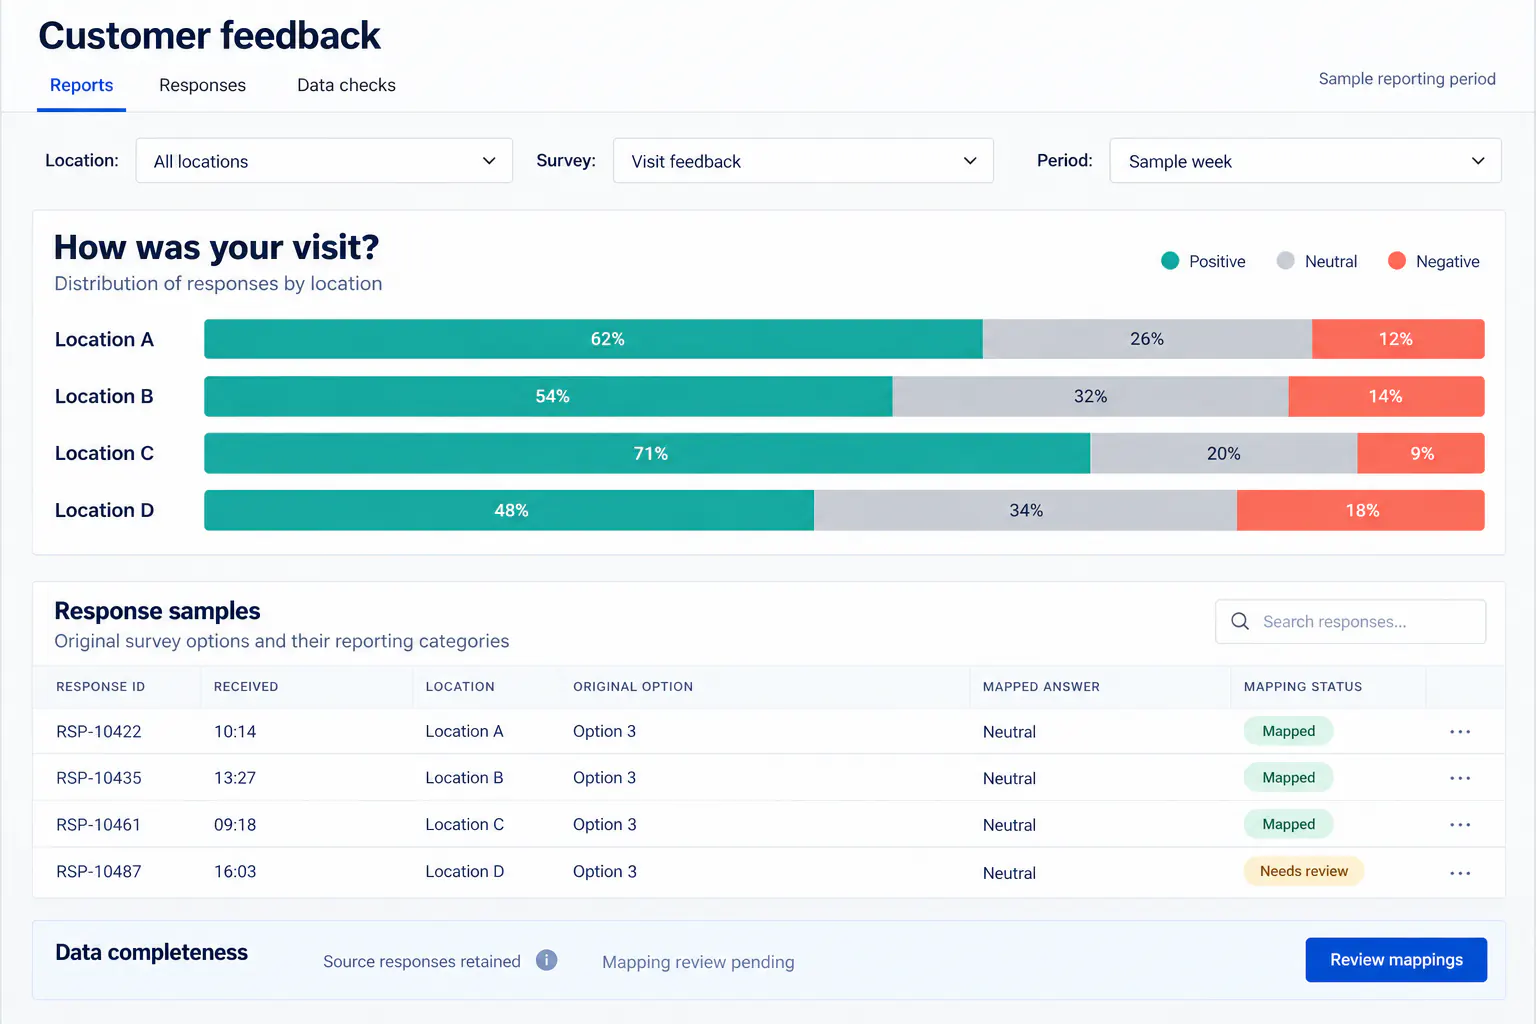
Fictional response distributions and mapping records illustrate the reporting workflow. All percentages and records are sample data, not client results. The mapping shown represents survey options, not an AI sentiment-analysis claim. View full-size interface (new tab)
The operating challenge
Survey configurations did not always follow the structure expected by the system. As a result, parts of the collected information were absent from the reporting data. Rebuilding a chart could not repair that break: the team first had to understand how original answers should map into the analysis.
At the same time, reports needed to remain responsive as the dataset grew. Cloud spending also increased, making the query path an operating concern for a small service business. Data correctness, response time, and the cost of generating a report had to be addressed together.
The delivery decisions
The application retained original survey data. When configuration errors caused gaps, the team used those records to reconstruct the expected mappings and wrote repair scripts. Preserving the source answers gave the recovery work something concrete to reconcile.
The application used React and Node.js with AWS serverless services and Athena. Work on the data architecture and cloud queries addressed report generation over a growing response history, including the infrastructure cost of serving that analysis.
Regular demonstrations let the client assess the reporting experience as it developed. That feedback connected technical work on storage and queries with the practical questions users needed the interface to answer.
How the workflow holds together
A displayed category is a derived result. If survey configuration changes how an answer is interpreted, the original response provides a route back to what was actually collected. In this engagement, retaining those records made a corrective mapping process possible.
The same operational view shaped performance work. A report that returns quickly but consumes an increasingly expensive query path can still become difficult to run as a service. The team continued to address reporting speed and cloud usage while maintaining the application already in use, rather than treating launch as the end of the data work.
The delivered result
Repair scripts mapped retained source answers back into the expected reporting structure.
Application and data work improved the report-loading experience compared with the legacy system.
Targeted optimization reduced the cost of the reporting workload described by the delivery team.
The system remains in use, with continuing maintenance and development of the existing reporting platform.
Case taxonomy
Discuss your project
Tell us how your business works and where your software needs to change.
Get in touch
Tell us what you need to build, modernize, automate, or augment with AI. We can start with a focused discussion or a no-risk 1-week trial.

“A fantastic company to work with.” After the initial rapid development project, American Shipping Co. kept two Shinetech developers embedded for nearly four years, supporting internal and external tools and new AI initiatives.
 CEO, American Shipping Co. - 5-star Google Review