Business semantics
Source data had to be mapped into consistent entities, relationships, calculations, and reporting rules.


Retail analytics case study
A retail operator needed to turn a large body of operating data into a consistent relational model and a usable library of role-aware management reports.
The situation
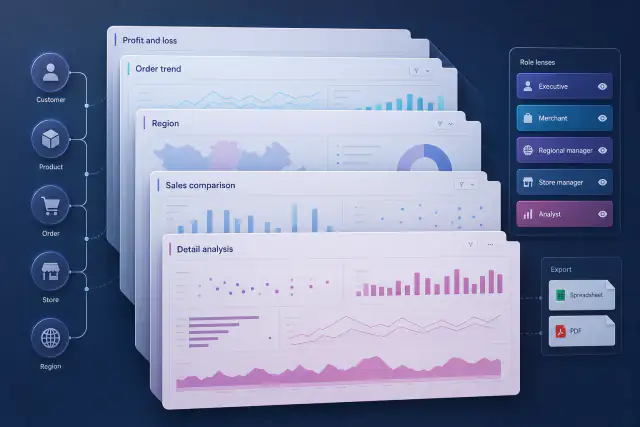
Information from customers, products, orders, stores, regions, and other operating areas had to be brought into a model that could support shared calculations.
Different roles then needed reports for sales, order trends, regional comparison, profit and loss, detailed investigation, and broader management review.
The challenge
Data definitions, calculations, role access, interactive analysis, and exports needed a common foundation.
Source data had to be mapped into consistent entities, relationships, calculations, and reporting rules.
Management, finance, merchandising, regional, and operational roles viewed the business differently.
Users needed interactive web reports, drill-down detail, and familiar export formats.
The solution
The team combined business analysis, SQL Server modeling, calculation logic, and an ASP.NET MVC interface for management reporting.
Consolidate core retail entities and define relationships, calculations, and reusable measures.
Create sales, order, region, comparison, profit and loss, and detail-analysis views.
Apply role privileges and provide spreadsheet and PDF outputs for authorized users.
How the work was structured
The team worked with stakeholders to understand existing data and the questions managers needed the product to answer.
A relational model and calculation layer provided a shared foundation so related reports did not redefine the same business concepts differently.
The web interface used ASP.NET MVC with jQuery and AJAX interactions, while SQL Server supported the underlying data and reporting logic.
Clarify data sources and management questions.
Define entities, relationships, and calculations.
Build role-aware analysis views.
Deliver authorized spreadsheet and PDF outputs.
The result
The documented system connected a broad report library with consistent data logic, interactive web access, permissions, and familiar export formats.
Related views could draw from the same modeled entities and business calculations.
Sales, order, region, financial, trend, and detail reports supported different operating questions.
Role privileges determined which reports and functions were available to each user.
Case taxonomy
Turn operational data into useful decisions
Get in touch
Tell us what you need to build, modernize, automate, or augment with AI. We can start with a focused discussion or a no-risk 1-week trial.

“A fantastic company to work with.” After the initial rapid development project, American Shipping Co. kept two Shinetech developers embedded for nearly four years, supporting internal and external tools and new AI initiatives.
 CEO, American Shipping Co. - 5-star Google Review