Several live sources
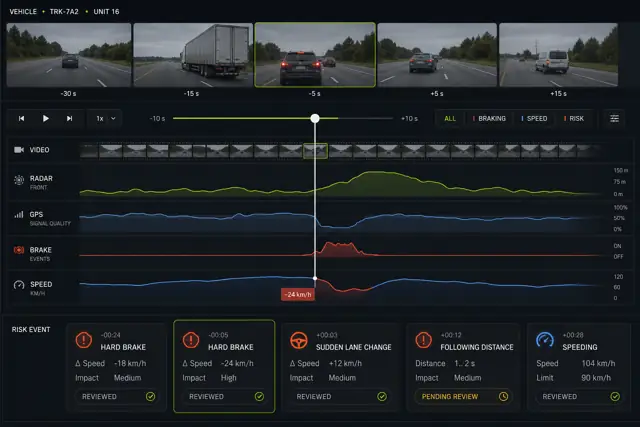
Radar, video, GPS, and behavior events arrived with different formats, timing, and confidence.


Connected fleet case study
A mobility technology provider needed one platform to turn live radar, video, GPS, and driving-behavior data into useful fleet visibility and driver-risk insight.
The situation
The product received information from several vehicle and sensor sources, including radar, video, GPS, and driving-behavior events. Each signal was useful, but separate views made fleet status and risk patterns harder to understand.
The client needed a coherent web experience that connected live vehicle location, event evidence, analytics, and follow-up without overwhelming users.
The challenge
The interface needed to preserve timing and context across several streams while making risk and fleet priorities easy to scan.
Radar, video, GPS, and behavior events arrived with different formats, timing, and confidence.
A risk signal was useful only when users could connect it to location, vehicle state, and supporting media.
Dense technical data had to become clear workflows for fleet and safety teams.
The solution
The team defined data contracts and time relationships first, then designed fleet views that connected live status, analytics, and evidence review.
Align sensor, GPS, media, vehicle, and behavior data around shared identifiers and timestamps.
Link each risk event to location, vehicle state, evidence, severity, and follow-up status.
Create fleet dashboards, vehicle detail, and review workflows for different operational roles.
How we worked
Engineering and product specialists agreed on event contracts before building dependent interface behavior.
The team tested normal driving, incomplete data, delayed media, and higher-risk events rather than a single ideal flow.
Performance work focused on keeping dense timelines and fleet views responsive as data volume increased.
Define identifiers, timestamps, and data contracts.
Connect live signals around vehicle events.
Build fleet, map, timeline, and evidence views.
Test operational and risk scenarios end to end.
The result
The platform brought vehicle position, sensor events, media, analytics, and review workflows into one experience, replacing fragmented signal inspection with a more useful operational context.
Users could review the information around an event without moving between disconnected tools.
Risk evidence and workflow status created a more consistent path from detection to action.
Normalized events supported continued development of fleet and safety insights.
Case taxonomy
Turn live signals into operating context
Get in touch
Tell us what you need to build, modernize, automate, or augment with AI. We can start with a focused discussion or a no-risk 1-week trial.

“A fantastic company to work with.” After the initial rapid development project, American Shipping Co. kept two Shinetech developers embedded for nearly four years, supporting internal and external tools and new AI initiatives.
 CEO, American Shipping Co. - 5-star Google Review